
Excel and Tableau: Customer Churn
Introduction
On Kaggle, I found a dataset of customer churn data for a fictitious bank deposited by Radesheshyam Kollipara. It is a simple dataset of just one table. The exercise analyzes which customers are most likely to exit the bank.
The table’s most critical column is the “Exited” column, which in the original data is one if the customer left the bank and 0 if the customer stayed. It also contains other information about each customer and their accounts. After my initial analysis, I found the following columns were most important in analyzing churn: customer age, account balance, credit score, and geography.
First, I analyzed the data in Excel using Power Query, Pivot Tables, and Pivot Charts. Then, I examined the data in Tableau. The visualizations were different, leading to different conclusions.
Before I analyzed the data, I binned the customers’ age, account balances, and credit scores to examine them as categorical variables. I left the geography column, which contained three countries (France, Germany, and Spain), the same. I also recorded the “Exited” column as having the words “Exited” and “Remained” to make the visualizations more interpretable.
In Tableau, I created charts that used the absolute count of customers that remained or exited. In Excel, I made charts showing remaining versus exited grouped within each binned category.
Let’s go through each category.
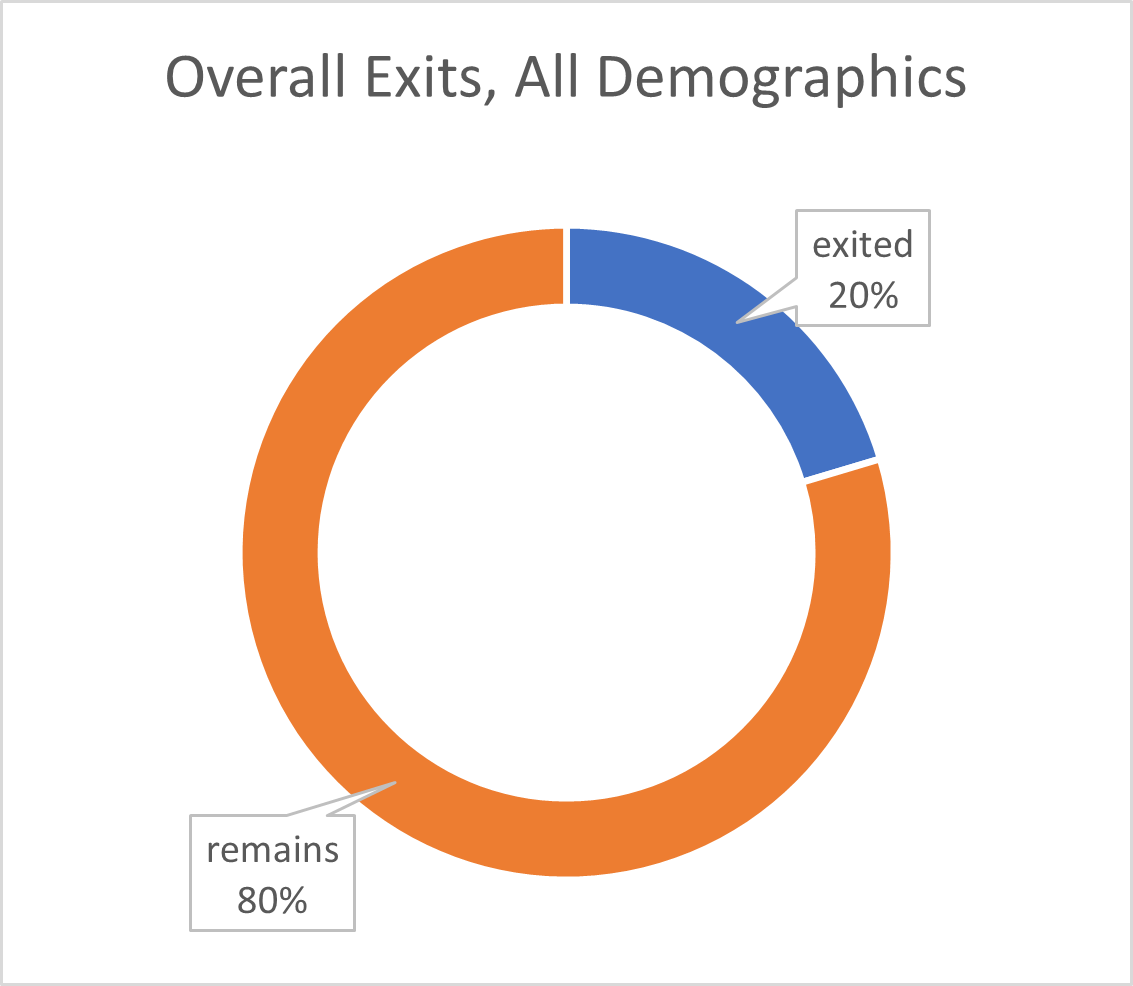
Overall Churn
About 20% of the bank’s customers churn:
Customer Age
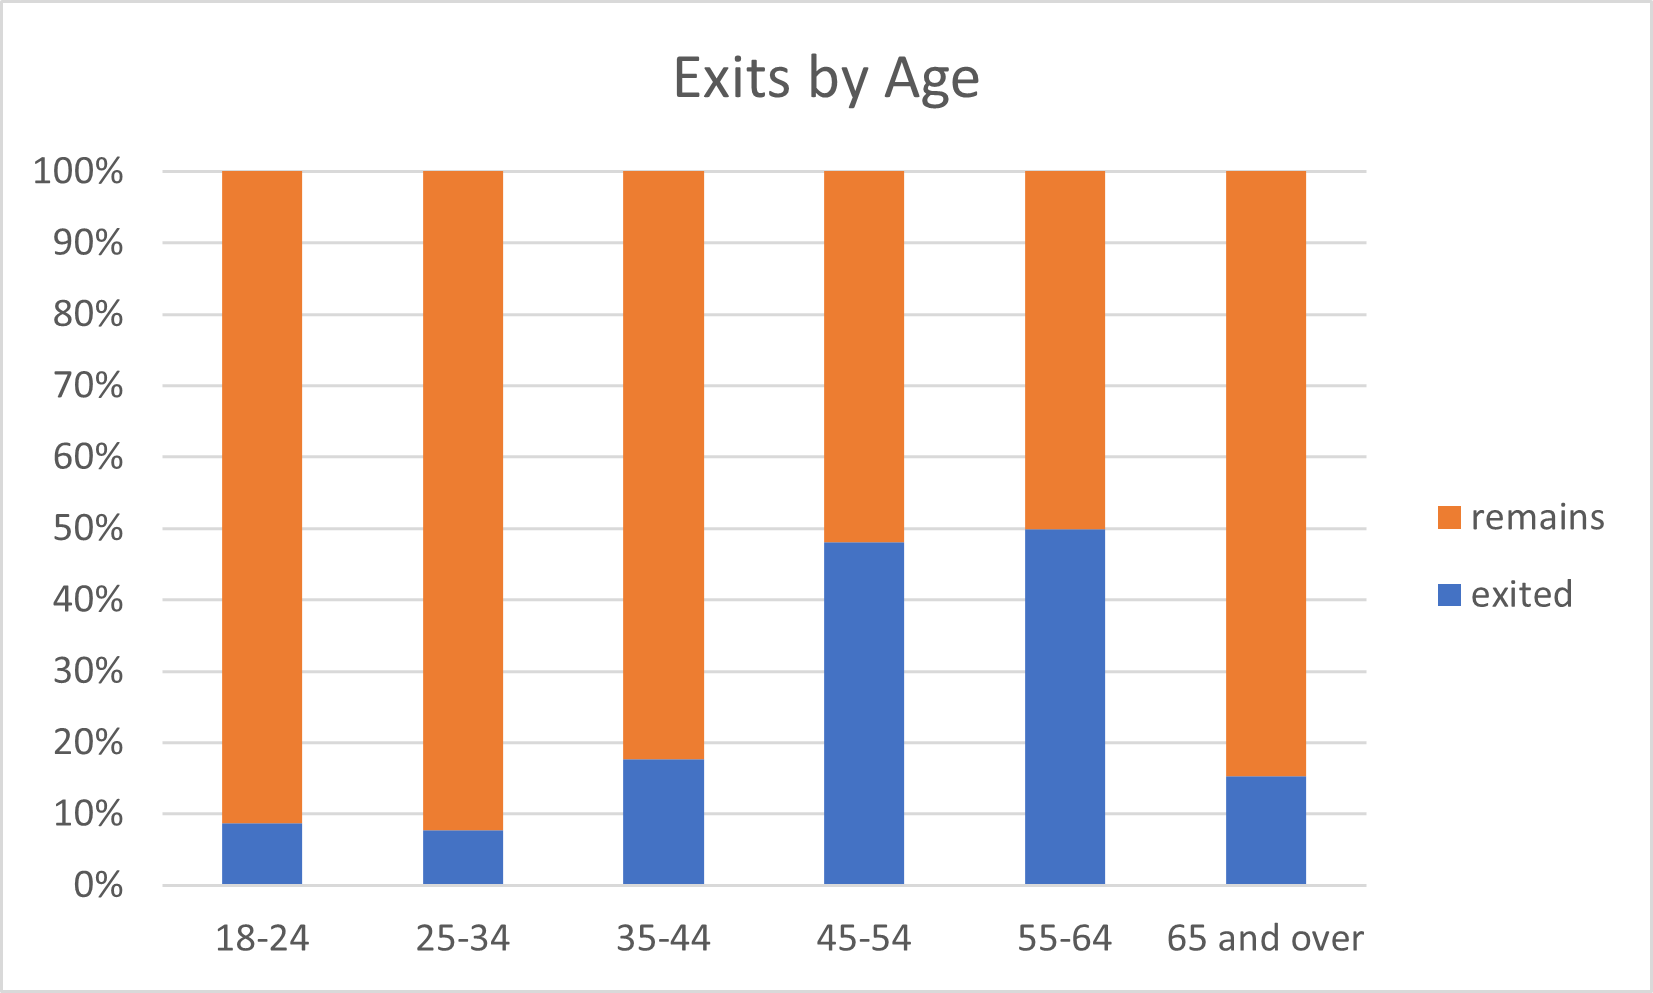 When exiting is shown as the percentage within each age group, we find customers aged 45 to 64 most likely to leave the bank.
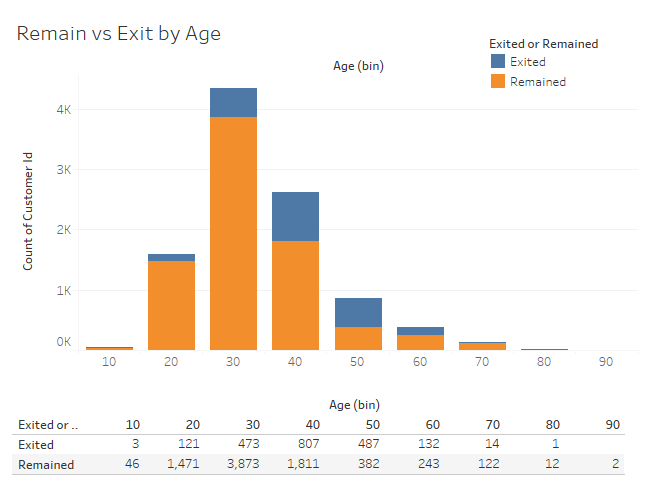 When shown as absolute numbers, we find the age category losing the most customers is the 40s age range. So these two results agree well. If the bank focused on retaining customers in their 40s, that might help its churn problem.
Geography
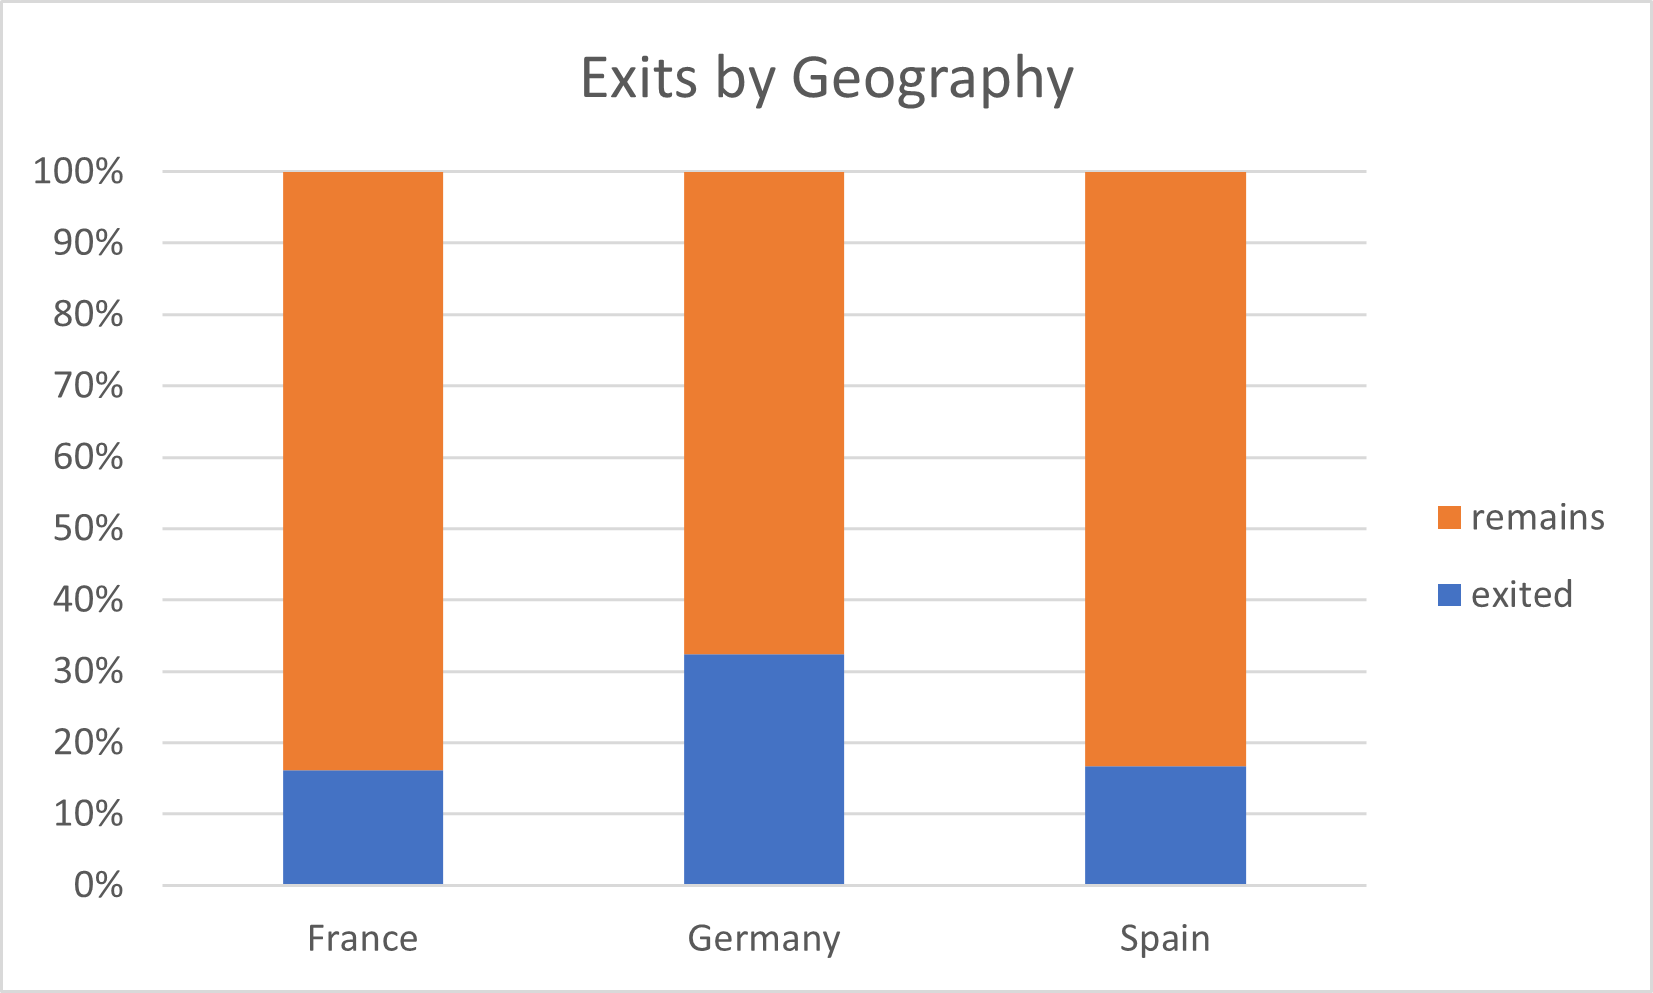
Taken within each country individually, Germany shows the most significant fraction of customers that leave.
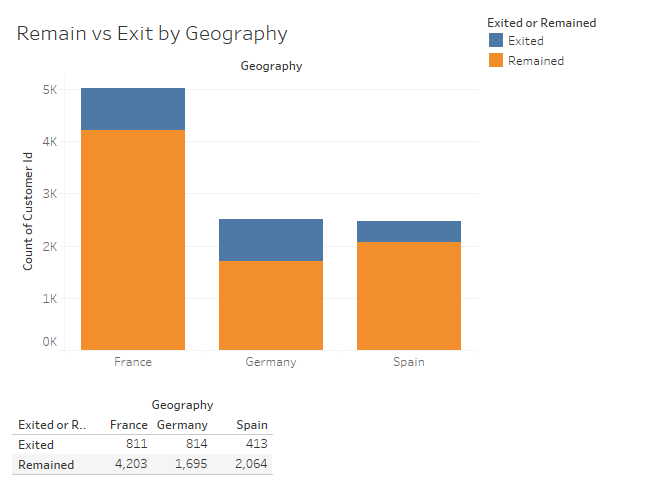 However, when examined in terms of count of customers leaving from each country, Germany and France have similar numbers. In this case, the bank should focus on reducing churn in the country that is most important to them.
Credit Score
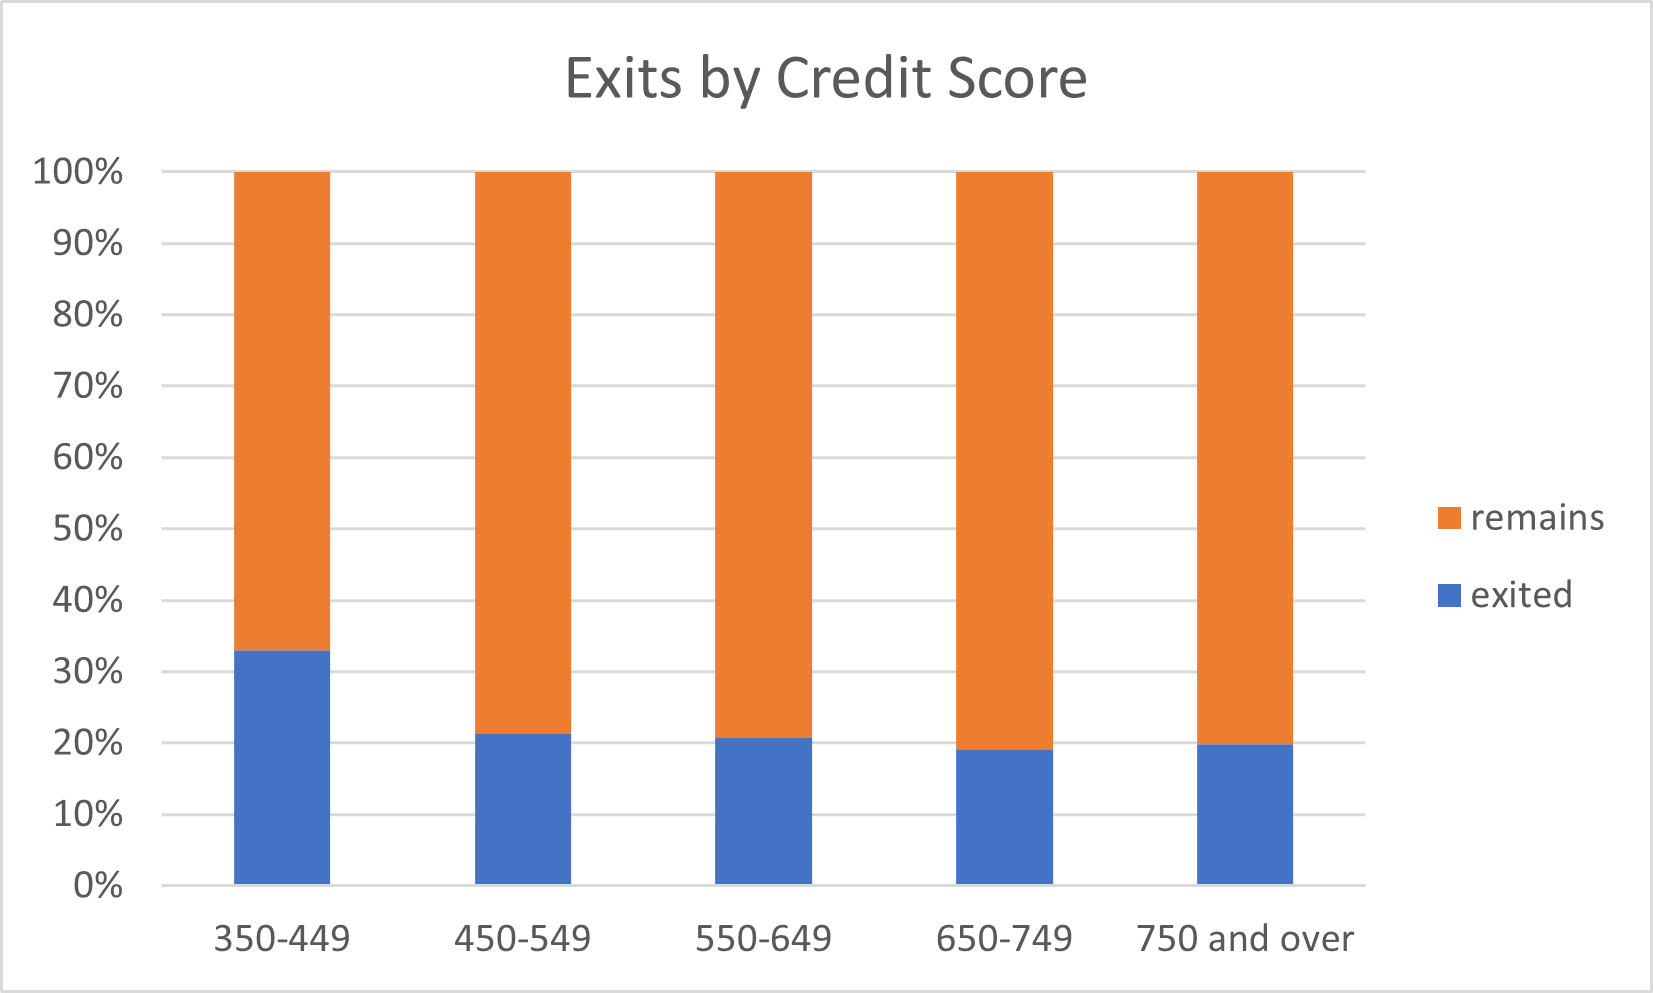
People with credit scores of 350-449 are slightly more likely to churn as a proportion of the group.
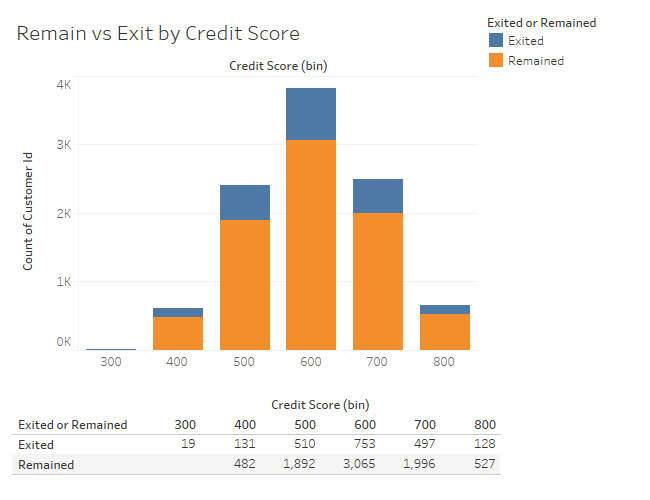
However, when observed in absolute numbers, there are more exits from customers with scores in the 600s. Since I doubt the bank wants customers with low credit scores, I recommend focusing churn-reduction efforts on customers with credit scores in the 600s.
Account Balance
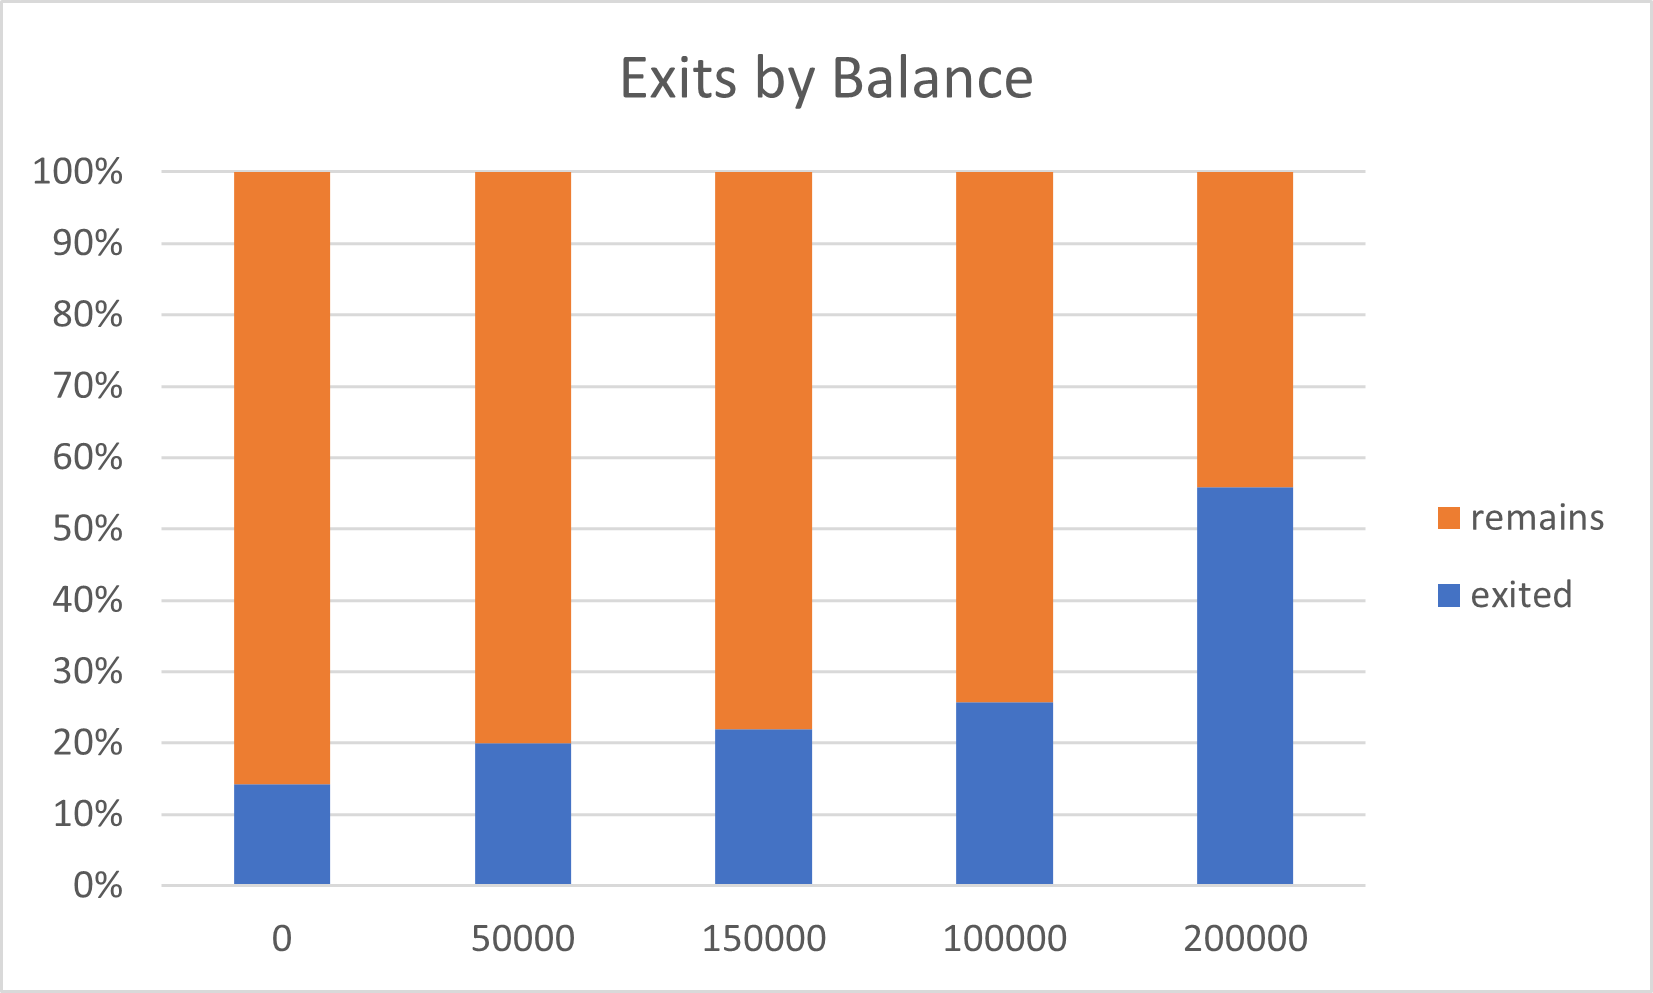
Customers with 200K or higher balances are the most likely to churn when observed as a proportion of each group.
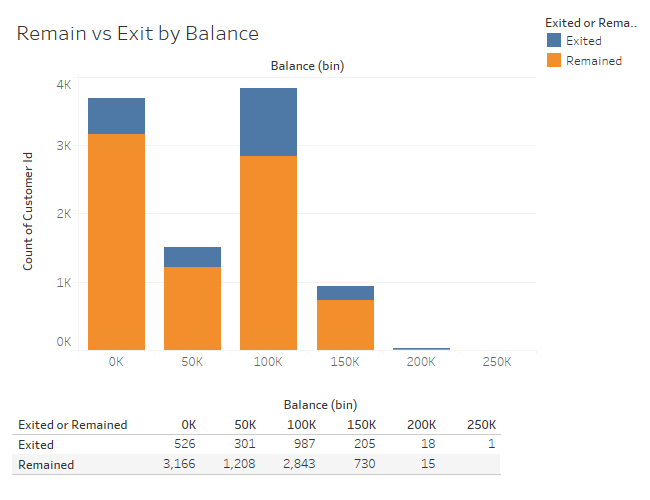 However, the 200K customers are a tiny fraction of the total customers at the bank. Instead, more customers with balances between 100K and 150K are leaving. The bank should focus on retaining the 100K to 150K balance customers.
Conclusion
You can arrive at very different courses of action depending on how you look at the data. If I did this analysis again, I would focus on the simple customer counts I found with the Tableau charts.
